Project
Company: MCNS | Mobile network operator project profile
Project Title: LTE-TDD C-Band RAN modernization analysis
Description
MCNS undertook the technical and techno-economic assessment of a C-Band RAN modernisation programme, examining the replacement of legacy LTE-Advanced baseband units and 4T4R radio and antenna systems with Release 17 NR-capable baseband and radio solutions. The assessment compared two equipment vendors and two target configurations: 4T4R with up to four downlink layers, and 8T8R with an assessed operating point of up to six aggregate downlink layers. The objective was to establish where modernisation could increase usable capacity, improve service coverage and support traffic growth within the operator’s capital budget.
The work brought equipment evaluation, configuration analysis, laboratory validation, field Proof of Concept activities and investment assessment into one decision process. MCNS examined the performance differences between the candidate solutions, the optional features required to obtain those benefits and the practical implications of introducing each solution into the existing network. The resulting benchmarking and techno-economic reports supported a phased deployment recommendation, with explicit acceptance conditions and identified integration risks.
Evidence basis. The project scope and activities are described from the supplied brief. No original vendor quotations, test logs or measured results were supplied for this profile. All numerical values in the following figures and tables are illustrative, reproducible engineering simulations and assumed budgets; they do not represent observed MCNS project results or verified vendor rankings. Vendor A and Vendor B remain anonymous.
Terminology. Release 17 is part of 5G NR; the formal 5G-Advanced designation begins with Release 18 [1]. This profile therefore uses “Release 17 NR modernisation”. 4T4R and 8T8R describe transmit and receive chains, not guaranteed spatial rank. Four and six layers are favourable operating limits rather than continuous operating states. The six-layer case is aggregate MU-MIMO across compatible users, not a claim of six-layer reception by a conventional four-receive-chain terminal [2].
Modernisation scope and equipment configuration
The baseline review covered the installed BBUs, processing headroom, radio units, antenna systems, supported bands, carrier bandwidths, transmission modes and software licences. MCNS assessed whether reuse of the site infrastructure was technically and economically justified, including mounting arrangements, feeder losses, power supply, cooling, synchronisation, transport capacity and management-system integration. Replacing the BBU alone would not provide NR operation: compatible NR radios, software, fronthaul and antenna arrangements were included in the target solution.
The vendor comparison examined supported cells and carriers per processing unit, bandwidth and MIMO processing limits, baseband pooling, fronthaul interfaces and line rates, hardware redundancy, timing requirements and software upgrade constraints. For the radio and antenna systems, the assessment considered aggregate and per-chain power, antenna gain and patterns, electrical tilt, azimuth, beamforming support, calibration, receiver performance and installation requirements. An 80 W total sector power constraint was applied to the illustrative comparison, corresponding to 20 W per chain for 4T4R and 10 W per chain for 8T8R before implementation losses.
Radio configuration analysis included LTE transmission-mode support, NR numerology, TDD downlink and uplink allocation, special-slot configuration, reference-signal overhead, CSI reporting, rank adaptation, CQI and MCS selection, HARQ behaviour and scheduler settings. LTE transmission-mode labels were not transferred to NR. Both solutions were assessed against the same traffic objectives and spectrum assumptions, with separate records for hardware capability, licensed availability and features actually enabled during testing.
The migration assessment also considered the selected NSA or SA architecture, its core-network and transport dependencies, device and CPE compatibility, and the availability of operational counters. The simplified numerical example isolates RAN performance and excludes additional core-network migration costs; these would require a separate budget where applicable.
Coverage and capacity assessment
MCNS combined coverage analysis with capacity dimensioning so that a higher peak throughput would not conceal weak uplink reach, unstable cell-edge performance or insufficient busy-hour resources. The assessment distinguished service coverage, usable sector capacity and user experience. Antenna improvements and interference management were evaluated alongside bandwidth, scheduled spatial rank and traffic loading.
Figure 1 presents a controlled comparison at the same 20 MHz channel bandwidth and 80 W aggregate sector power. The 4T4R NR case has no assumed antenna or SINR advantage over LTE; its modest benefit comes from an explicitly assumed implementation efficiency improvement. The 8T8R case adds an assumed 2 dB effective beamforming advantage and the possibility of six aggregate layers under favourable conditions. Neither benefit follows automatically from the release number or the chain count.
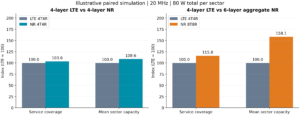
Figure 1. Simulated service coverage and mean sector capacity, normalised to LTE = 100. Left: LTE 4T4R versus NR 4T4R. Right: LTE 4T4R versus NR 8T8R. Maximum layer counts are four, four and six respectively; realised rank varies with SINR.
Two vendor benchmarking and optional feature validation
MCNS developed a common evaluation matrix for the two vendors, covering mandatory requirements, optional capabilities, configuration dependencies and commercial exclusions. The assessment separated a feature’s advertised availability from its release-specific implementation and demonstrated performance. Candidate configurations were compared on equivalent spectrum, total transmit power, antenna assumptions, test devices, traffic profiles and loading conditions.
Laboratory work focused on repeatable functional and performance checks before field exposure. Candidate items included 256QAM operation, CSI and rank reporting, SU-MIMO and MU-MIMO scheduling, sounding and reciprocity calibration where supported, interference rejection combining, interference coordination, carrier aggregation where licensed, QoS handling and energy-saving behaviour. Each optional feature required a clear applicability statement, licence and hardware prerequisites, and an enabled-versus-disabled test to isolate its contribution. Not every item was assumed to be a Release 17 innovation or universally supported by both vendors.
Field PoC activities addressed the conditions that laboratory tests cannot fully reproduce: clutter, terrain, sector overlap, external interference, mobility, timing alignment and realistic user distribution. MCNS prepared the PoC document, defining site and route selection, reference configurations, test equipment, software versions, logging requirements, repeat runs, acceptance criteria and exception handling. Tests were structured to identify whether a performance delta arose from radio hardware, software features, antenna configuration, terminal capability or unequal test conditions.
The field assessment covered downlink and uplink throughput, cell-edge service, throughput distributions, latency, session stability, mobility interruption, BLER, HARQ retransmissions, PRB utilisation, reported rank and channel quality. Separate single-user and loaded-sector runs were required. A conventional drive-test terminal could validate its own supported layers; the six-layer aggregate case required concurrent compatible terminals or CPEs and scheduler-side counters, rather than inference from one handset throughput trace.
Techno-economic assessment and deployment budgeting
The financial analysis related coverage and capacity improvements to the cost of the complete modernisation package. The cost scope included allocated BBU processing, radio and antenna equipment, required licences, installation, integration and acceptance testing. Transport expansion, site acquisition, core migration, taxes and financing were excluded from the illustrative budget, and would need explicit inclusion where required by the actual programme.
For transparency, the illustrative 4T4R package is budgeted at €18,000 per sector for Vendor A and €20,000 for Vendor B. The 8T8R package is €26,000 and €29,000 respectively. These are planning assumptions, not market quotations. Shared BBU costs are allocated per sector without double counting. Existing LTE equipment is treated as a sunk asset, with €0 incremental retention CAPEX; its historical purchase cost is not reconstructed.
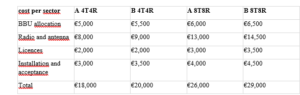
Figure 2 uses Vendor A’s assumed costs for a 100-sector programme. It varies the fraction of sectors modernised from zero to 100%, retaining the remaining LTE sectors. The model assumes statistically identical sectors, no additional sites and no coverage overlap effects. Coverage gain is therefore the relative increase in the sum of serviceable sector areas within fixed planning discs; it is not a prediction of new geographical territory or unique population coverage. Linear rollout curves are a budgeting simplification, not an optimised site-selection result.

Figure 2. Simulated coverage and capacity gain versus incremental modernisation CAPEX. The endpoints correspond to €1.8 million for 100 NR 4T4R sectors and €2.6 million for 100 NR 8T8R sectors. LTE retention is the zero-cost reference.
The preferred deployment sequence would prioritise sectors where the identified limitation matches the proposed upgrade. High traffic and suitable spatial conditions may justify 8T8R, while a lower-cost 4T4R replacement may be sufficient where processing obsolescence or software support drives modernisation. A coverage-limited site may instead require antenna changes, uplink improvement or an additional site. These alternatives must be compared before assuming that more transmit chains provide the best return.
Illustrative drive route and cost per throughput
Figure 3 uses a synthetic 10 km route with common distance variation and correlated shadow fading for all configurations. It shows the aggregate full-buffer downlink rate available to the scheduled test-user set at each route point. For 8T8R this represents a coordinated multi-user field campaign; it is not a six-layer single-handset measurement. Rank falls as channel conditions deteriorate, exposing the difference between a favourable high-rank operating point and the performance sustained over a route.

Figure 3. Synthetic drive-route throughput comparison. Both panels share the same propagation realisation. The cost indicators use the Figure 2 per-sector CAPEX and the area-weighted mean sector rates from Figure 1, rather than the route average.

CAPEX per delivered bit/s is calculated as allocated modernisation CAPEX divided by mean aggregate sector rate in bit/s. For readability, the table uses €/Mbps; divide by 1,000,000 for €/(bit/s). The incremental metric divides the same cost by the additional rate over LTE. This distinction matters because a cheap upgrade with a small gain may have a high cost per added Mbps. These are capital-efficiency ratios, not a price per transmitted bit, a lifecycle TCO result or a subscriber tariff.
Vendor B is deliberately assigned the same simulated radio performance as Vendor A because no vendor-specific measurements were supplied. Under that neutral assumption its capital-efficiency ratios increase in direct proportion to its assumed cost: 11.1% for 4T4R and 11.5% for 8T8R. A technical preference between the vendors would require actual PoC results, availability commitments, operational evidence and commercial offers. No vendor winner is inferred from the illustrative simulation.
Simulation assumptions and interpretation
The numerical exercise is a reduced-order planning simulation, not a 3GPP-conformance, link-level BLER or calibrated system-level study. It uses 100,000 uniformly area-distributed outdoor samples in a sector planning disc from 0.1 to 2 km, with shared Gaussian shadow fading of 5 dB standard deviation. The C-Band carrier is assumed at 3.5 GHz. An analyst-selected log-distance loss PL = 140 + 35 log10(d) dB is used with d in kilometres; it is not claimed to reproduce a specific TR 38.901 scenario. Terrain, penetration, azimuth pattern, spatial correlation between users and explicit neighbouring-cell scheduling are not modelled [3].
The link budget uses 49.03 dBm total conducted power, 17 dBi nominal antenna gain, 2 dB loss and a fixed effective noise-plus-interference floor of −86 dBm across the occupied band. This floor abstracts a loaded interference environment; it does not separately model thermal noise or dynamic interference. Effective SINR equals transmit power plus antenna gain minus losses and path loss, plus shadow fading and the assumed beamforming gain. Beamforming gain is 0 dB for LTE and NR 4T4R and 2 dB for NR 8T8R; equal total conducted power therefore does not imply equal directional EIRP.
The net throughput model is R = B × fDL × η × r × min[6.5, 0.75 log2(1 + γ/r)], where R is in Mbps for B = 20 MHz, fDL = 0.75 is the common downlink time share, η = 0.70 for LTE or 0.76 for NR is the residual implementation and overhead factor, r is aggregate rank and γ is linear effective SINR before equal layer-power division. Rank is 1 below 4 dB, 2 from 4 to 10 dB, 3 from 10 to 17 dB and the configured maximum above 17 dB. These heuristic thresholds and the spectral-efficiency cap are assumptions, not normative rank-selection rules or transport-block calculations.
Service coverage is the percentage of the fixed planning area supporting at least 10 Mbps in a separate rank-one full-resource downlink test. It does not assert uplink, control-channel, indoor or busy-hour coverage. Mean capacity is the average of the full-buffer aggregate rate over the area samples; real capacity additionally depends on scheduler fairness, user geometry, spatial separability, traffic and QoS. The route uses 501 points, a deterministic radial distance between approximately 0.12 and 1.87 km and AR(1) shadowing with coefficient 0.94 at 20 m spacing. Random seed 1708 fixes the sample realisation.
Sensitivity follows directly from the assumptions: setting the NR 4T4R efficiency equal to LTE removes its simulated gain; removing the assumed 8T8R beamforming advantage removes the associated coverage benefit; limiting aggregate rank to four reduces the 8T8R capacity advantage. Full four- or six-layer operation over an entire service area is not assumed. A production investment model should replace these inputs with calibrated propagation, measured feature gains, observed rank distributions and actual vendor costs.
MCNS project technical reports and deliverables were
- Baseline network audit and BBU, radio and antenna replacement assessment, including infrastructure reuse and integration dependencies.
- Two-vendor technical compliance and configuration comparison, with hardware limits, software releases, licences and optional feature prerequisites.
- Laboratory validation plan and feature assessment, including controlled enabled-versus-disabled comparisons and documented functional limitations.
- Field PoC document covering sites, routes, devices, multi-user arrangements, KPIs, repeatability, acceptance conditions and evidence collection.
- Modernisation benchmarking report linking field logs, radio counters and configuration records to the observed performance differences.
- Combined coverage and capacity assessment for LTE 4T4R, NR 4T4R and NR 8T8R deployment alternatives.
- CAPEX model and scenario comparison, including equipment allocation, implementation costs, sensitivity analysis and cost per added capacity.
- Deployment risk assessment, pilot-to-rollout prerequisites, migration sequencing, rollback arrangements and operational acceptance requirements.
- Consolidated technical and techno-economic recommendation supporting vendor selection, deployment priorities and the operator’s capital-budget decision.
Technical references
[1] 3GPP, Technical Highlights, Issue 3, 2021. Confirms the 5G-Advanced designation from Release 18.
https://www.3gpp.org/ftp/Information/Highlights/2021_Issue03/Highlight_Issue_3_final_web.pdf
[2] 3GPP TS 38.214 V17.11.0, NR Physical layer procedures for data, Release 17. Reference for NR physical-layer procedures and CSI codebooks; actual UE capabilities remain configuration dependent.
https://www.etsi.org/deliver/etsi_ts/138200_138299/138214/17.11.00_60/ts_138214v171100p.pdf
[3] 3GPP TR 38.901, Study on channel model for frequencies from 0.5 to 100 GHz, Release 17. Reference for subsequent calibrated propagation work; the present log-distance model is analyst-defined.
https://www.etsi.org/deliver/etsi_tr/138900_138999/138901/17.00.00_60/
Affiliated companies: Rural Connect