Project
Company: MCNS | LEO NTN deployment and investment feasibility study
5G Advanced NTN techno economic feasibility and sustainable deployment
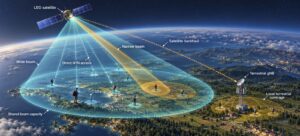
LEO satellite beams over connected Earth
Description
This MCNS project study evaluates how a mobile operator can introduce LEO satellite connectivity within a 5G and 5G-Advanced service portfolio. It compares two investment models: satellite backhaul for remote terrestrial base stations, and direct NTN access for compatible devices. The objective is to identify deployable service options, quantify their commercial thresholds and establish the evidence needed before committing capital or recurring satellite capacity expenditure.
The assessment connects coverage gaps and service demand with RAN, core-network, transport, terminal and operational requirements. Satellite backhaul is evaluated against feasible fibre and microwave alternatives; direct access is evaluated as an operator partnership with defined eligibility, capacity, wholesale and integration conditions. Civil UAV connectivity, positioning assistance and sensing-data transport are considered separately where their requirements justify a distinct business case.
Study basis and technical scope. This is an illustrative project feasibility study developed from the MCNS LEO NTN analysis, not a claim of a completed client deployment or measured supplier results. Release 18 is the 5G-Advanced baseline; NTN capabilities must be checked against the relevant specification version, equipment, software and device support [1–4]. Satellite backhaul does not itself make terrestrial access NR-NTN. Direct satellite services are not all equivalent to standards-based NR-NTN.
Coverage requirements and addressable users
Serviceable coverage requires more than satellite visibility. For remote terrestrial sites, the assessment covers downlink quality, uplink reach, indoor demand, terminal installation, sky visibility, energy supply and backhaul availability. Conventional terrestrial handsets can remain in use. For direct access, eligibility depends on compatible RF bands and software, spectrum authorisation, satellite availability, link budget, terminal orientation and the intended outdoor or obstructed environment. These conditions must be verified for the target country and service.
The commercial funnel separates population inside the footprint, technically eligible devices, likely paying subscribers and simultaneous active users. Adoption is not inferred from coverage area. We assess geographic and time-dependent demand, distinguishing messaging, intermittent telemetry and broadband. Positioning assistance is evaluated against accuracy and integrity requirements; transporting sensing reports is distinguished from performing sensing. Neither assured navigation nor flight-critical connectivity is inferred from ordinary communications availability.
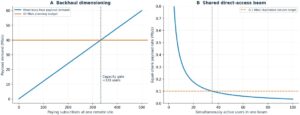
Figure 1. Illustrative service dimensioning. A: 10% simultaneous activity at 1.2 Mb/s per active user gives 0.12 Mb/s average demand per subscriber; a 40 Mb/s planning budget supports about 333 subscribers. B: 10 MHz × 0.35 bit/s/Hz gives 3.5 Mb/s of net beam capacity; a 0.1 Mb/s equal-share target permits at most 35 simultaneous users. These simplified resource budgets are assumptions, not supplier performance claims.
Capacity and the performance available to each user
For satellite backhaul, usable service is constrained by both the terrestrial RAN and the contracted transport. The 40 Mb/s budget in Figure 1 assumes 50 Mb/s usable payload capacity with a 20% planning reserve. This is a mean busy-hour screening calculation, not a queueing-delay or percentile-throughput guarantee. Monthly usage allowances are dimensioned separately: continuous 40 Mb/s payload would consume approximately 12.96 TB over 30 days, using decimal units. Contracted volume, contention, congestion and restoration therefore affect both feasibility and cost.
For direct access, bandwidth, net spectral efficiency, beam reuse and the operator’s available share determine the payload budget. Figure 1 assumes the entire 3.5 Mb/s beam is available to the service; any smaller allocation lowers capacity proportionally. The financial subscriber base must be mapped to per-beam busy-hour activity, not merely spread over national coverage. Validation addresses latency variation, loss, mobility and service continuity; NR-NTN additionally requires assessment of applicable timing, Doppler, assistance information and protocol behaviour [2–4].
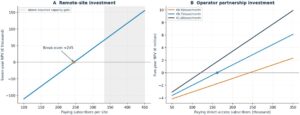
Figure 2. Reproducible incremental cash-flow scenarios using the source analysis. A: remote-site NPV, with the assumed capacity gate from Figure 1 shaded. B: direct-access partnership NPV at three net monthly contribution levels. All inputs are illustrative, constant in real terms, and exclude tax, debt financing, subsidies and terminal value. No revenue is attributed simply to additional Mbps.
Techno economic assessment and investment risk analysis
Remote-site case. Initial CAPEX is €55,000: €45,000 for the terrestrial site, power and installation, plus €10,000 for the satellite terminal and integration. Fixed operating expenditure is €2,250/month, comprising €850 for site operation and €1,400 for connectivity. Net contribution is €13 per paying subscriber per month before these fixed costs. Over seven years at a 10% real discount rate, break-even is approximately 245.5 subscribers; the implementable threshold is 246. At 250 subscribers the NPV is approximately €3,421. This is financially positive only if the assumed coverage, capacity and contribution remain attainable.
Direct-access partnership case. Initial integration CAPEX is €2 million, annual fixed operating cost €900,000 and net incremental contribution €0.75 per subscriber per month after variable wholesale and service costs. Over five years at 12% real discounting, break-even is approximately 161.6 thousand paying users. At 200,000 users NPV is approximately €1.24 million. This national subscriber threshold is not a beam-capacity result. Wholesale minimum commitments, geographic traffic concentration and capacity expansion costs can change it materially.
The financial model uses NPV = −K₀ + Σₜ CFₜ/(1+r)ᵗ, with initial incremental investment K₀, annual incremental net cash flow CFₜ, real discount rate r and agreed horizon T. Constant-case cash flows are 12Nm − F, where N is paying subscribers, m is monthly contribution after variable costs and F is annual fixed expenditure. Ramp-up, churn, outages, replacement CAPEX and tariff changes require year-specific cash flows. Retention, avoided terrestrial expenditure and resilience are counted only where attributable and without double counting. Client deployment decisions require operator data and binding supplier terms.
Investment controls cover demand and adoption, satellite capacity, terminal availability, authorisation, service continuity, supplier concentration and delivery delays. Each material exposure is linked to an owner, mitigation and evidence required before release of the next investment tranche. A representative pilot should verify busy-hour performance, billing and entitlement, alarms, failover and restoration. Wider rollout follows agreed technical acceptance and commercial thresholds; an attractive unconstrained NPV does not override a failed service-capacity test.
Sustainability and operational feasibility
Sustainability is assessed for the delivered service, with a declared accounting boundary. The example compares average site loads of 1.6, 1.2 and 0.9 kW, including the terminal and local supporting equipment. At 8,760 hours per year and 0.25 kgCO₂e/kWh, these correspond to 14.02, 10.51 and 7.88 MWh/year and 3.50, 2.63 and 1.97 tCO₂e/year. The lower-load cases are conditional scenarios, requiring validation of coverage, traffic, availability and power-control behaviour.
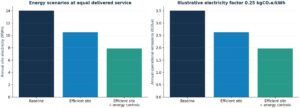
Figure 3. Illustrative local-site electricity and operational emissions at equal delivered service. This boundary excludes satellite manufacture, launch, constellation operation and replacement, shared gateways and network cloud, embodied equipment emissions and end-of-life impacts. It does not establish full lifecycle superiority over fibre, microwave or another satellite system.
The operator study should obtain supplier lifecycle evidence, country-specific electricity factors, site metering and asset-lifetime assumptions. Energy cost is already included in the site OPEX baseline and must not be added twice. Renewable supply, storage, cooling and equipment reuse are assessed for both reliability and lifecycle cost. Energy per delivered GB can supplement absolute consumption only with a consistent traffic and service boundary; low traffic can increase that ratio even at an efficient site.
MCNS project technical reports and deliverables
- Operator baseline and service requirements, separating terrestrial backhaul, direct satellite access and specialist enterprise services.
- Architecture and integration assessment covering RAN placement, N2/N3 transport, 5GC, terminal eligibility, authentication, OSS/BSS and service continuity.
- Satellite supplier and partnership evaluation covering capacity commitments, service availability, device support, wholesale charges and contractual dependencies.
- Coverage and market assessment distinguishing geographic footprint, eligible devices, paying subscribers and simultaneous active demand.
- Capacity and traffic model covering terrestrial bottlenecks, backhaul headroom, monthly volume and shared satellite beam resources.
- Pilot and acceptance plan with representative equipment, repeatable KPIs, outage tests, restoration criteria and deployment gates.
- Editable incremental cash-flow model with CAPEX, OPEX, NPV, break-even, adoption ramp-up and coupled capacity and price sensitivities.
- Sustainability and risk assessment covering site electricity, operational emissions, asset reuse, evidence gaps and mitigations.
- Consolidated feasibility report and phased operator investment recommendation, including deployment priorities, contractual conditions and reasons to defer non-viable options.
Technical references and study provenance
[1] 3GPP, Release 18 overview. 5G-Advanced release context.
https://www.3gpp.org/specifications-technologies/releases/release-18
[2] 3GPP TS 38.300, NR and NG-RAN overall description; TS 38.331, NR RRC; and TS 38.321, NR MAC. Use the applicable Release 18 versions and supported feature set. Official specifications:
https://www.3gpp.org/specifications-technologies/specifications-by-series
[3] 3GPP TR 38.811 and TR 38.821, NR NTN studies. Study conclusions are distinguished from normative requirements.
[4] 3GPP TS 23.501, 5GS architecture, including applicable satellite-backhaul provisions.
[5] MCNS, LEO NTN TechnoEconomic Feasibility Editable, supplied source analysis; financial assumptions reproduced for illustration. Additional capacity and energy scenarios in this profile are explicitly stated study assumptions.